Insights
Engineering-Led Visualizations: Transforming Roadway Design Communication
The integration of 3D visualizations into roadway design is no longer a luxury – it’s a necessity. While architects and landscape architects have traditionally led the charge in creating compelling visual narratives for projects, a shift is underway. Engineers are stepping into the spotlight, leveraging visualization tools not just for aesthetics, but as a core component of design, coordination, and stakeholder engagement.
The Problem with Architect-Led Visuals
Architectural visualizations often serve as early-stage marketing tools – eye-catching renderings that help secure approvals or generate public interest. However, these visuals are typically static, created with software that doesn’t align with engineering workflows. As a result, engineers are frequently handed designs that are visually appealing but technically infeasible. This disconnect can lead to friction, rework, and misaligned expectations.
The Case for Engineering-Led Visualization
Engineering-led visualizations bridge the gap between design intent and technical feasibility. By integrating visualization into the engineering workflow, teams can produce dynamic, data-rich models that evolve with the project. These models are not just “pretty pictures” – they are functional tools that enhance communication, improve coordination, and support decision-making throughout the project lifecycle.
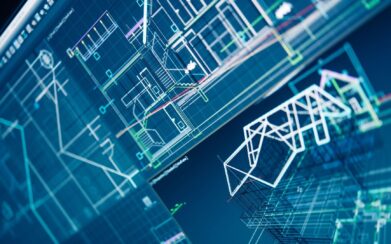
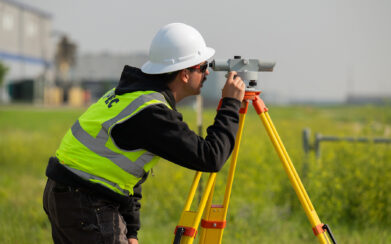
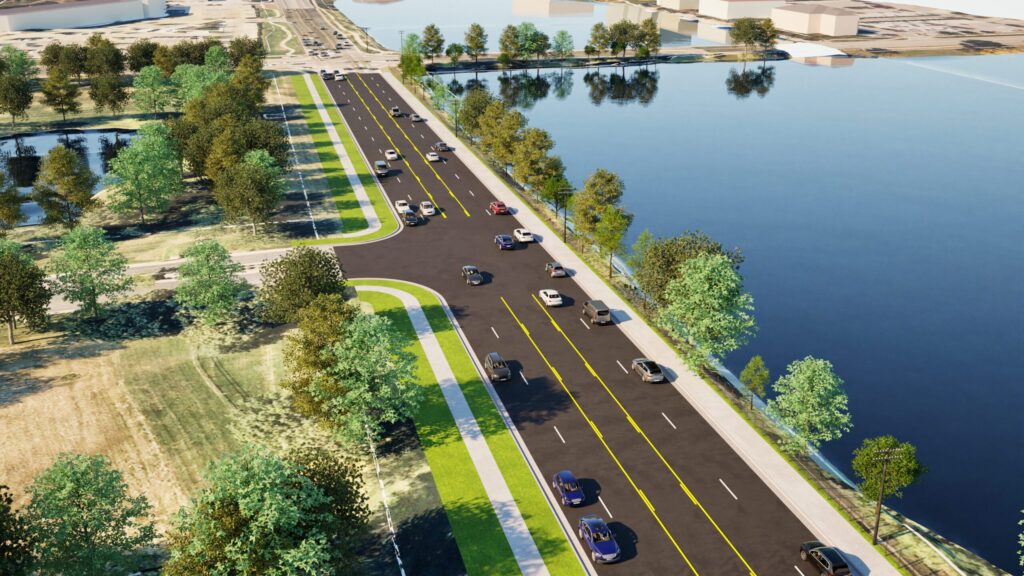
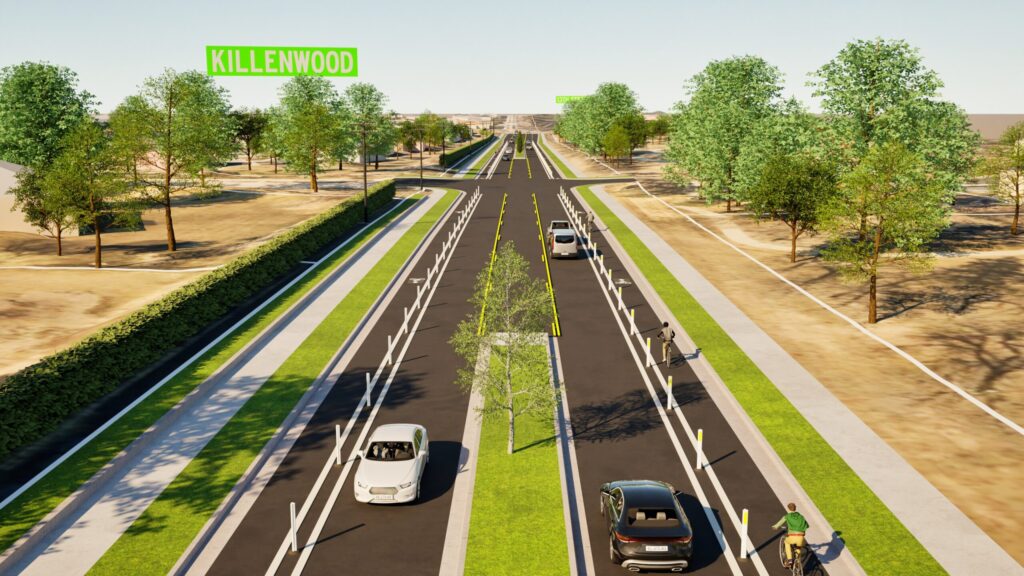
Take, for example, a mile-long arterial roadway upgrade. Traditionally, this would be represented in 2D strip maps, which lack the vertical context critical for understanding terrain, drainage, and property impacts. By using tools like Autodesk’s InfraWorks and various rendering engines, engineers can create 3D models that incorporate real-world survey data, utility layouts, and design components. These models can then be rendered into high-quality visuals or flythroughs that clearly communicate the project’s scope and impact.
Benefits Across All Phases
- Concept Phase: Visualizations help secure funding, gain stakeholder buy-in, and build public support. They provide a realistic preview of the project, grounded in engineering data.
- Design Phase: Engineers can use 3D models to coordinate with utility companies, assess property impacts, and streamline internal reviews. These models are easily updated as the design evolves.
- Construction Phase: Visualizations can depict traffic control plans and construction phases, helping the public understand how to navigate work zones and reducing confusion during implementation.
Seamless Integration
The beauty of engineering-led visualization lies in its efficiency. Engineers are already designing in 3D – corridor modeling, pipe networks, and grading are standard practice. By repurposing this existing data into visualization platforms, teams can produce compelling graphics with ease. It not only improves project clarity but also leverages existing design efforts to their fullest potential.
Looking Ahead
As technology continues to advance, the role of engineers in visualization continues to grow. By taking ownership of the visual narrative, engineers can ensure that what’s shown to stakeholders is not only beautiful but also buildable. This shift empowers engineers to lead with clarity, precision, and confidence – transforming how roadway projects are communicated and delivered.